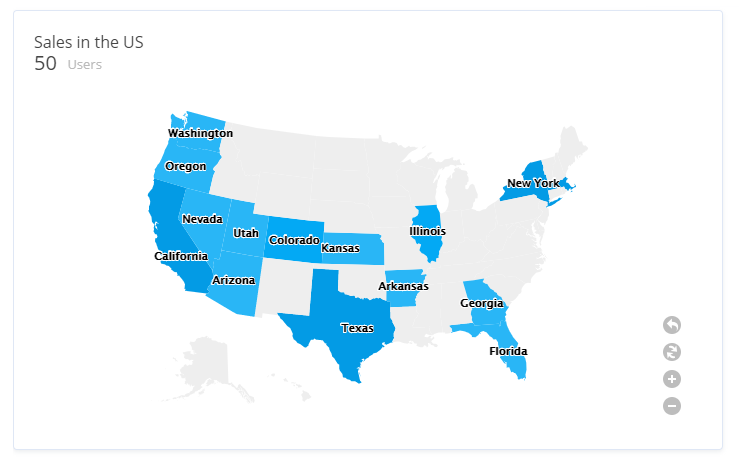
How to create a map chart
How to visualize data demographically in a Map chart?
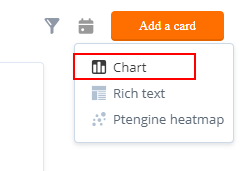
- Click on Add a card and select Chart
- Select your Datasource and select the Metric and Category which you want to visualize
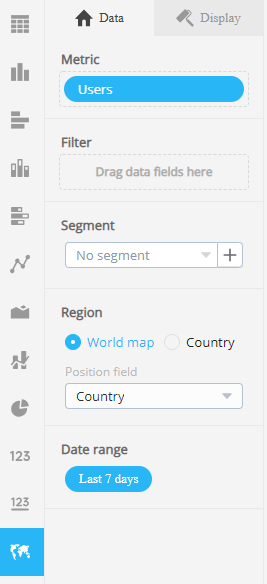
- Select the Map icon
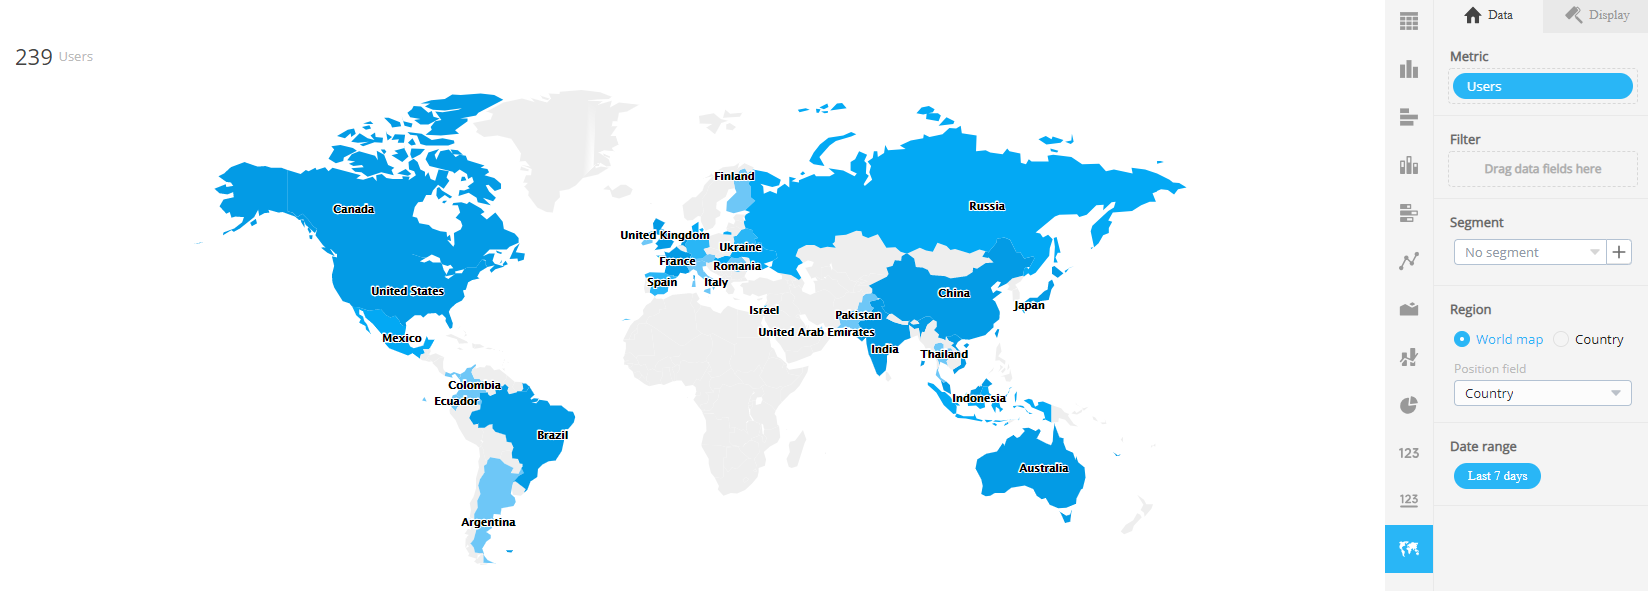
- Optional: add a filter for specific countries
- The result will look like this:
