How to make your first dashboard in Datadeck
In this quick How to you’ll learn how to make a dashboard in Datadeck
The first thing you need to do is create a dashboard; this is where you’ll add all your information. Click on the green “plus” button on the left side of your screen and select “Add a dashboard.”
- Make sure you are logged in to Datadeck
- Click Create new, and select Dashboard

- Make sure to select dashboard
- A new dashboard canvas will be created and now it’s time to add cards and data sources

- Click Create
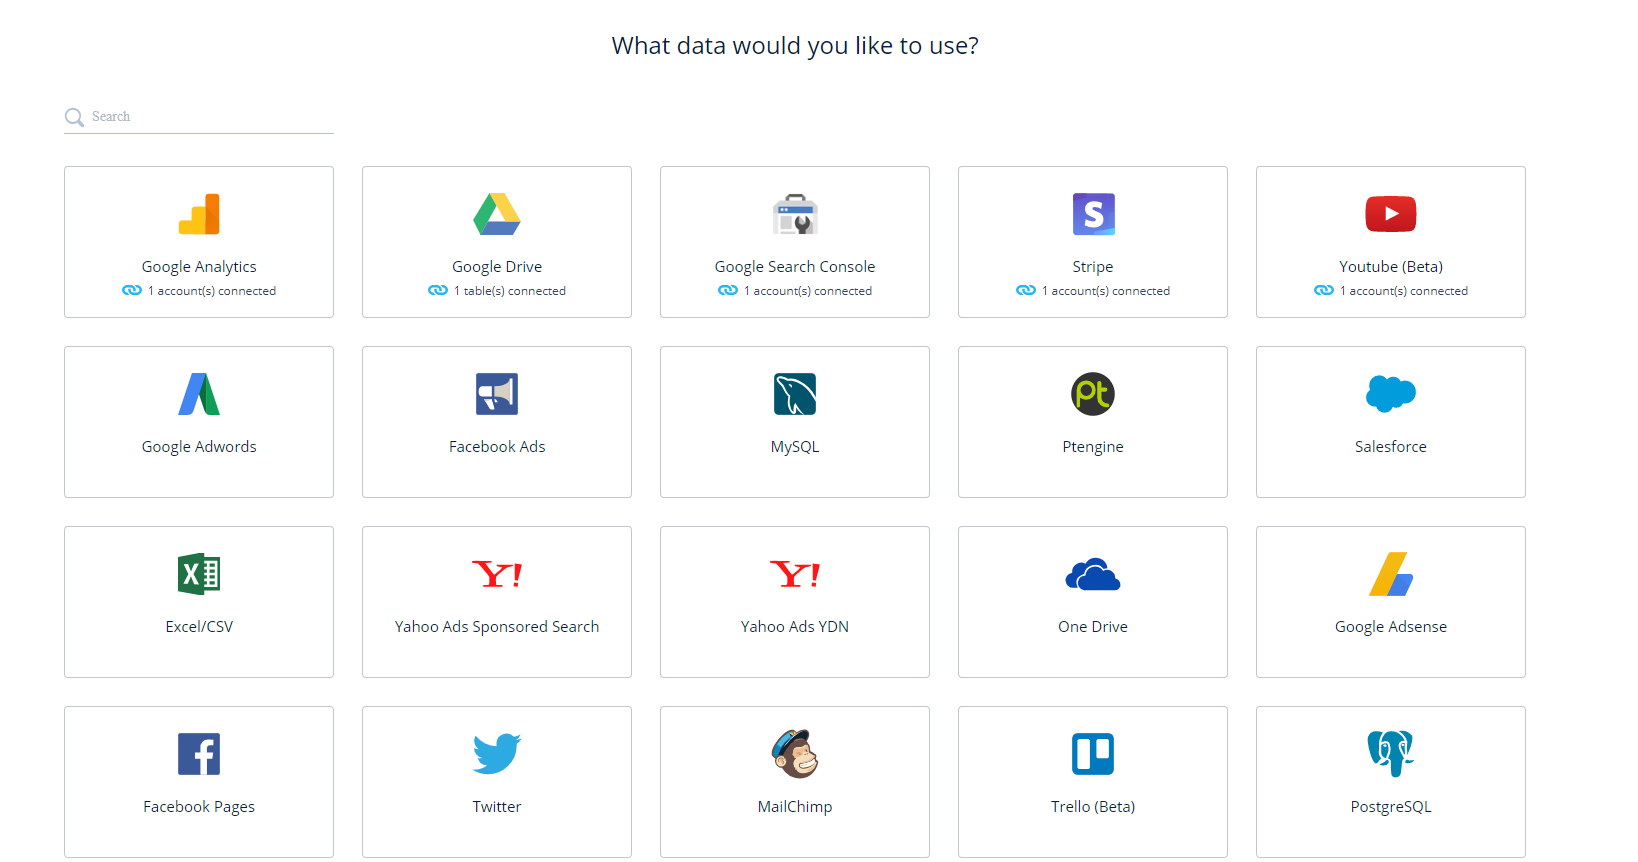
- The data selection screen will appear to help you quickly create cards by selecting the data you want to use

- Click on the data you’d like to use (in this sample we will add Google Analytics)

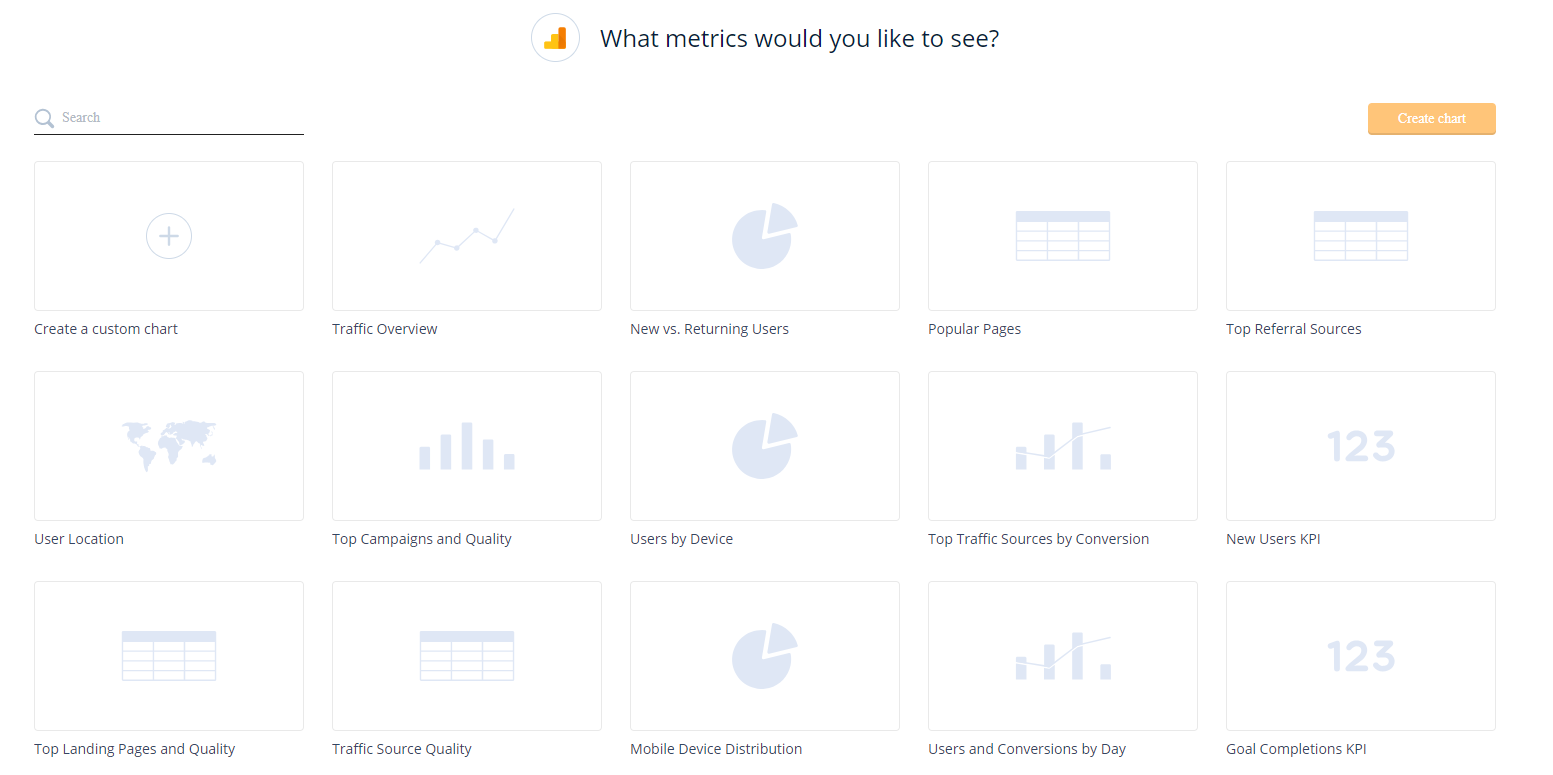
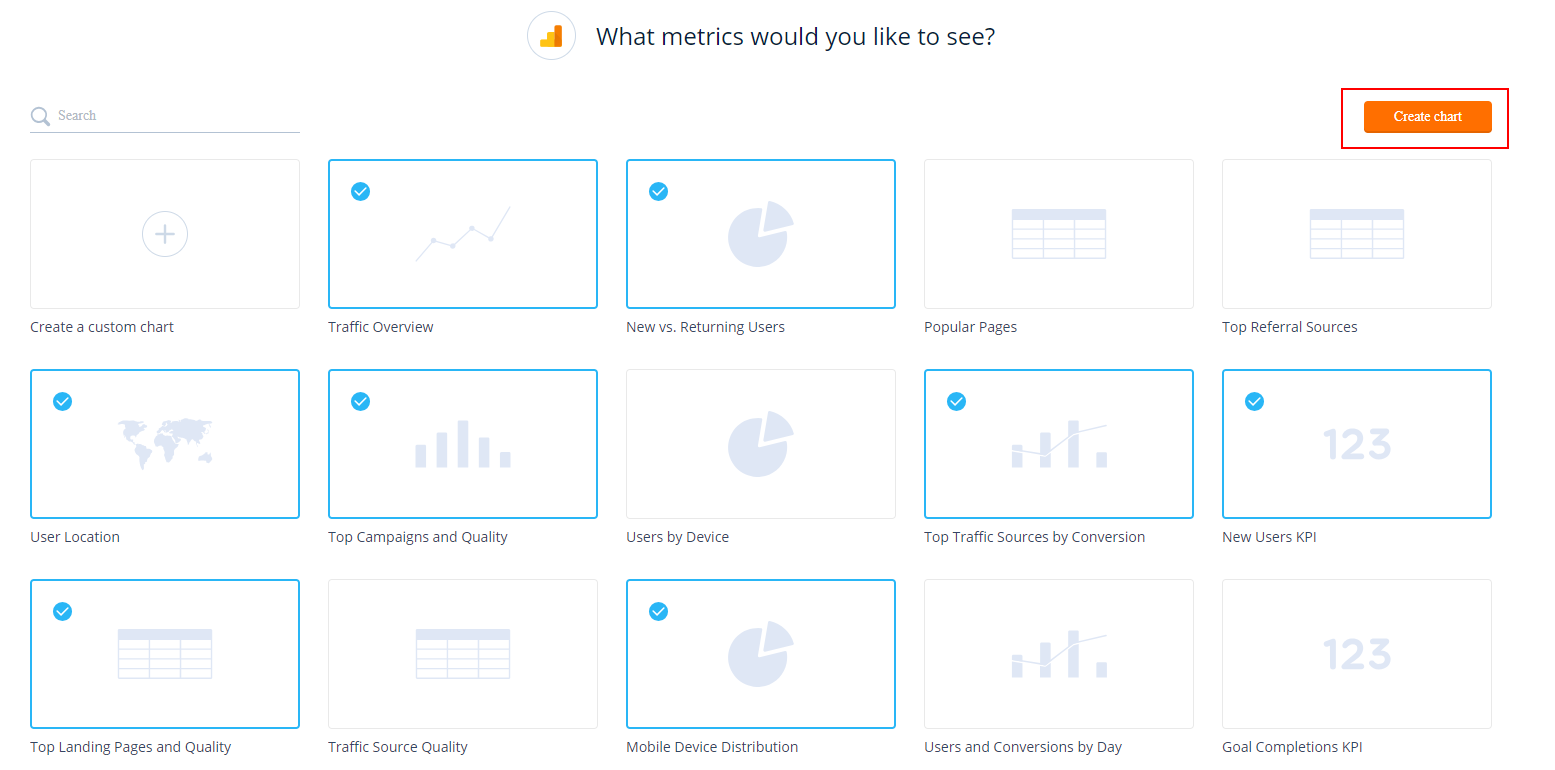
- Datadeck will offer you predefined cards with insights that are already made for you. Simply select the cards you’d like to add to your dashboard. You can also choose to do it manually by selecting: “Create a custom chart”
- After selecting the cards and charts you’d like click Create

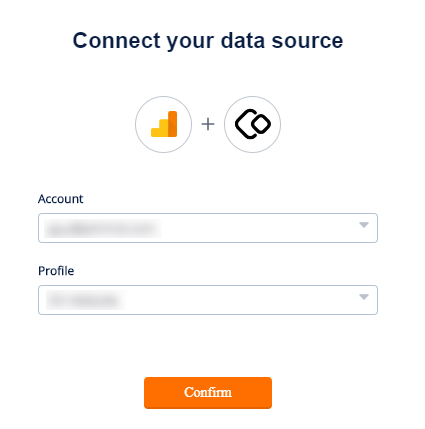
- In this case Google Analytics will ask me what website I would like to use for this dashboard, select the correct account or add a new account

- Click Confirm and you are all set!
