How can we help

Hello. How can we help?

Help Center>Dashboards & Cards>How to create a map chart

Home Getting Started Account Settings Data Sources Collaboration Dashboards & Cards

How to create a map chart

How to visualize data demographically in a Map chart?

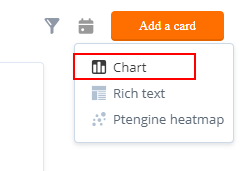
  1. Click on Add a card and select Chart
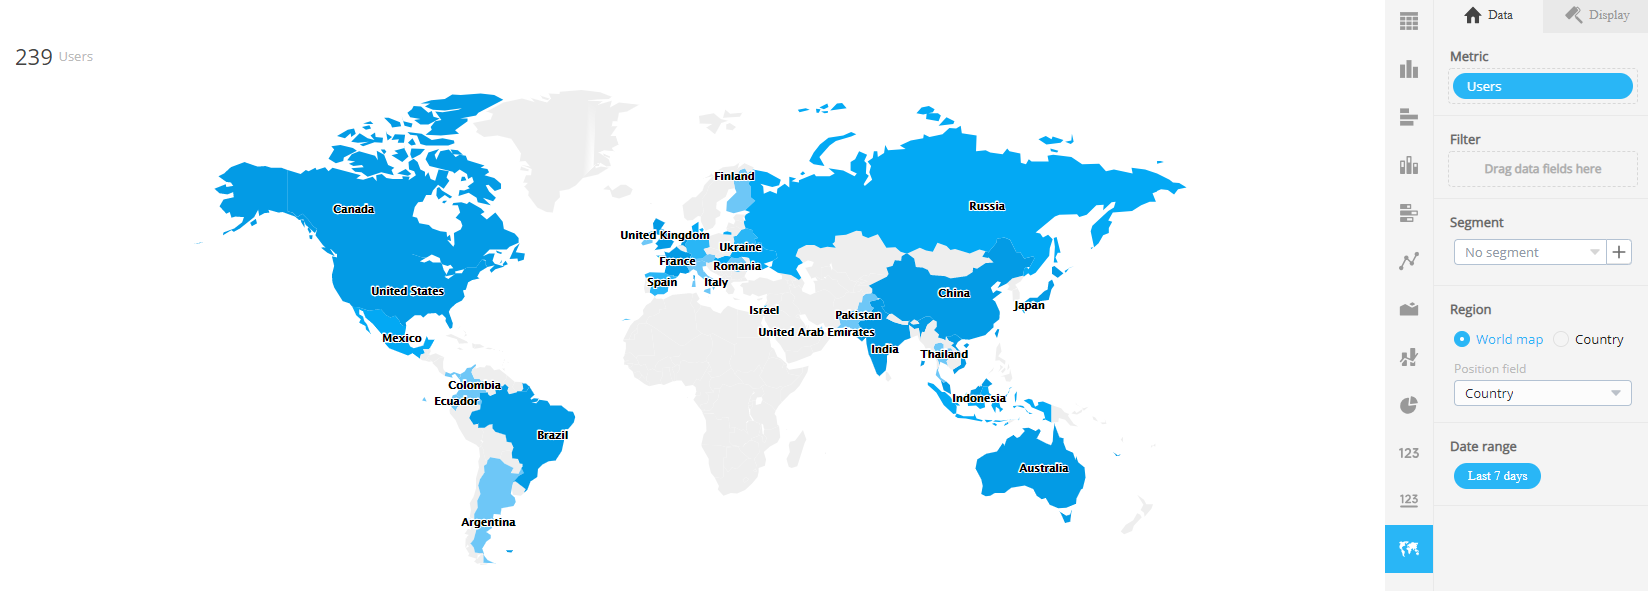
  2. Select your Datasource and select the Metric and Category which you want to visualize
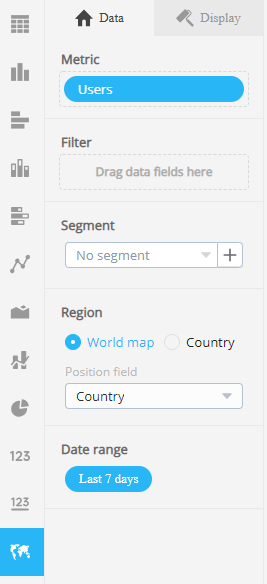
  3. Select the Map icon
  4. Optional: add a filter for specific countries
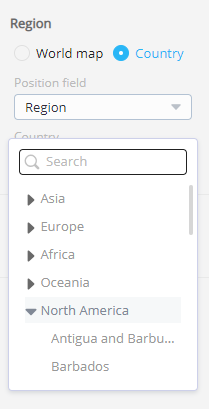
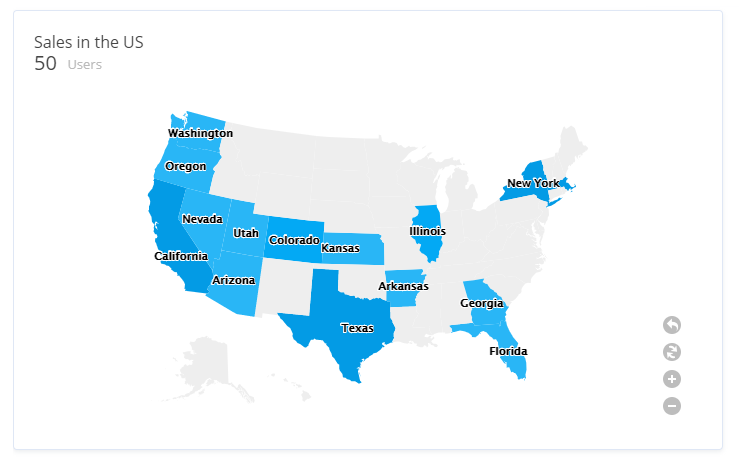
  5. The result will look like this:

Did this answer your question?

Couldn't find what you're looking for? Contact us by email: support@datadeck.com.

Related Articles

Metrics Versus Categories Language Selection How to make your first dashboard in Datadeck Adding a card How to move a card from one dashboard to another What is a data source? Compare two metrics over a specific period of time How to apply filters on your data How to add a dashboard to a folder Create or Duplicate a Dashboard