Facebook Ads : Sample Dashboard
Connect and Visualize Facebook Ads Data in Datadeck
Which key metrics to visualize from Facebook Ads?
Here is an example on How to Setup A Facebook Ads Dashboard
We will also show you what key metrics and cards you might want to use!
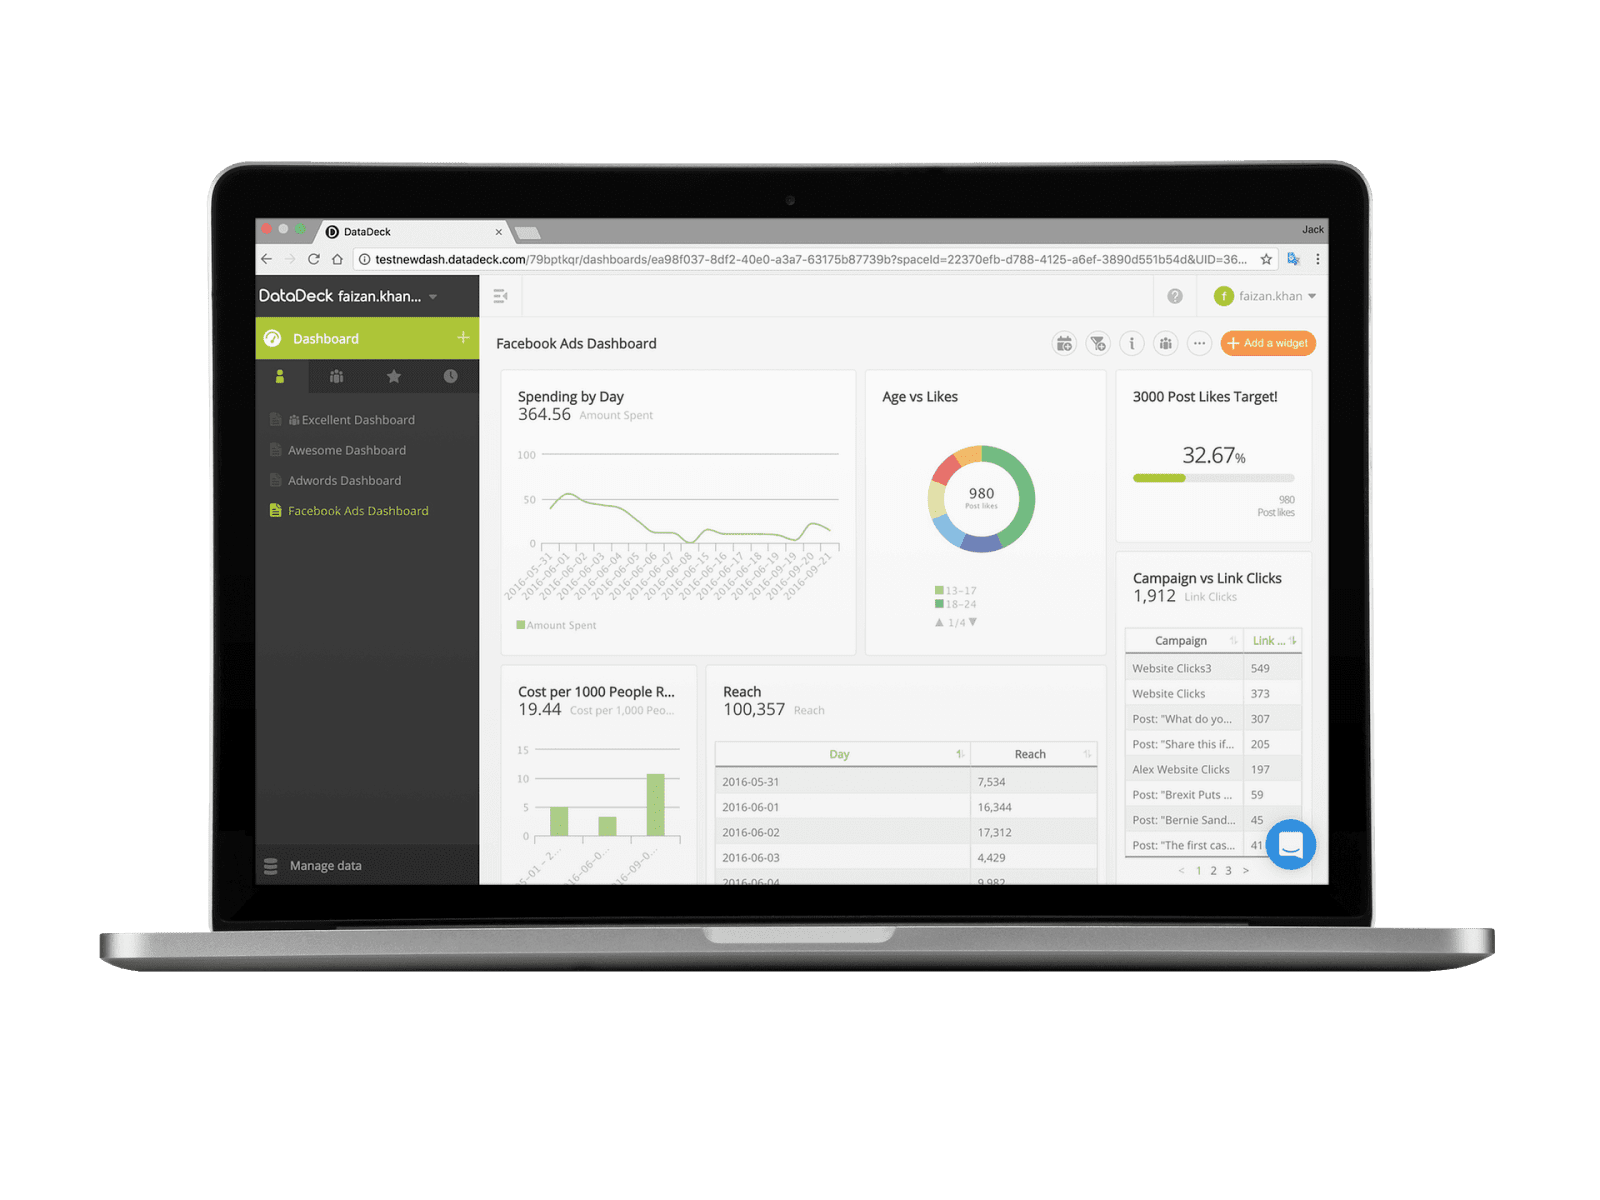
Now that you have connected Datadeck to your Facebook account, you can create a Dashboard that shows your Facebook Ads data, or even displays it alongside data from any other data sources you have connected to. (If you’re having trouble connecting to Facebook, please contact support through the chat button on Datadeck’s interface)
Facebook Ads Cards
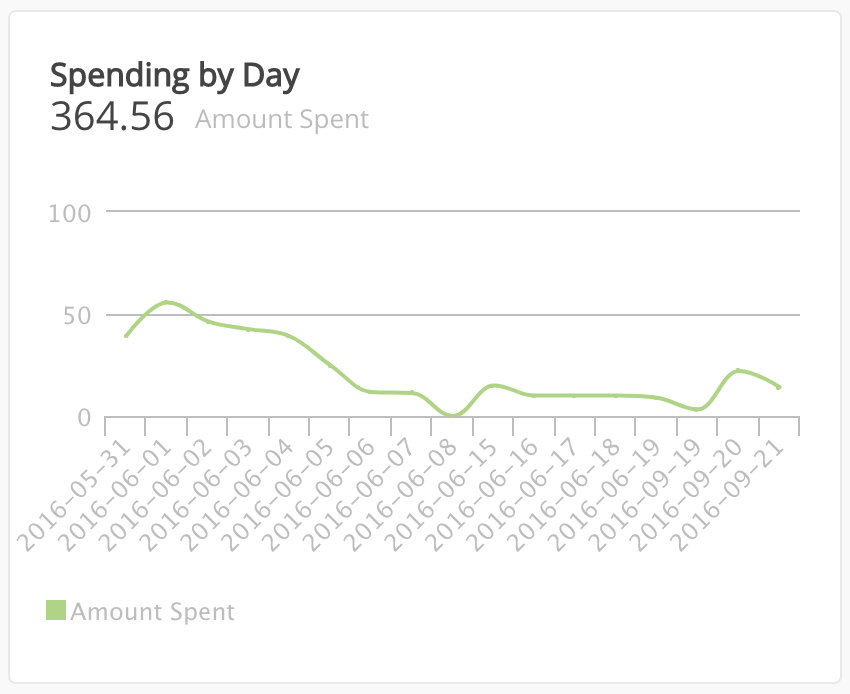
1. Spending by Day
Explanation – This shows the amount of money spent on ads, post boosts etc
Metrics – Amount Spent
Category – Day
Graph Type – Line
Filters – None
Date Range – Set as appropriate
2. Reach
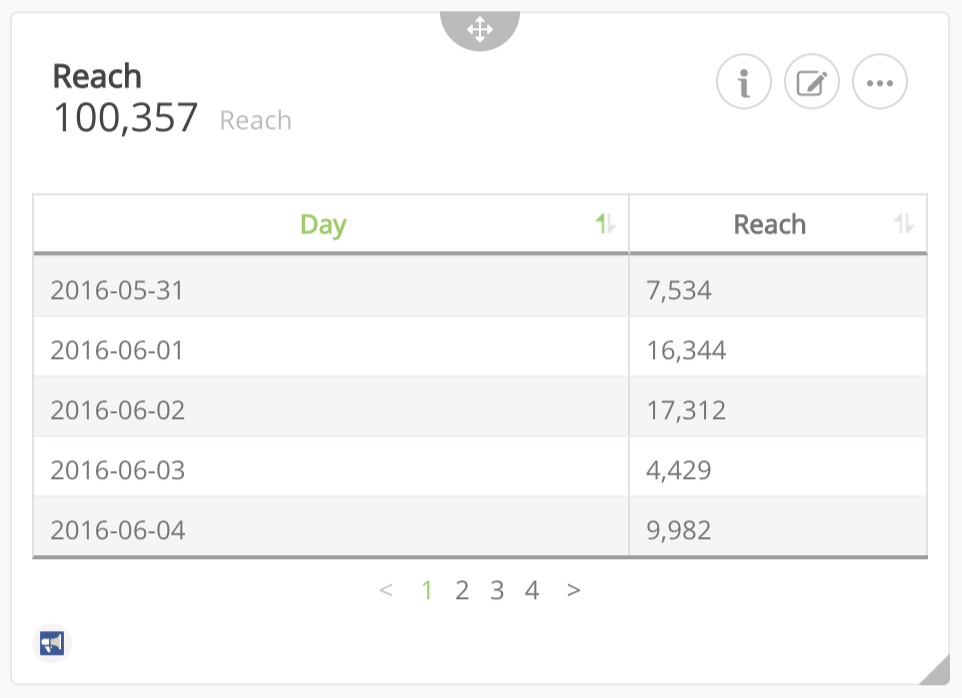
Explanation – This shows the reach your ads had over time.
Metrics – Reach
Category – Day
Graph Type – Line
Filters – None
Date Range – Set as appropriate
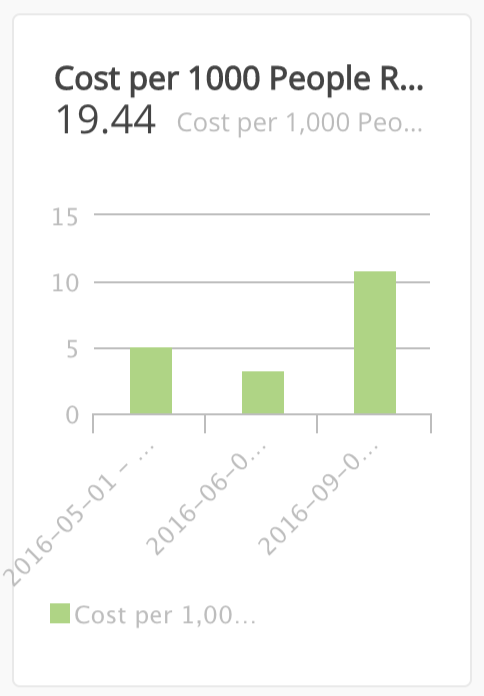
3. Cost Per 1,000 People Reached
Explanation – Shows per month what the average cost per 1,000 people you reached is. Great for seeing if you are successfully optimizing your campaigns and making them more cost effective.
Metrics – Cost Per 1,000 People Reached
Category – Month
Graph Type – Column
Filters – None
Date Range – Set as appropriate
4. Age vs Likes
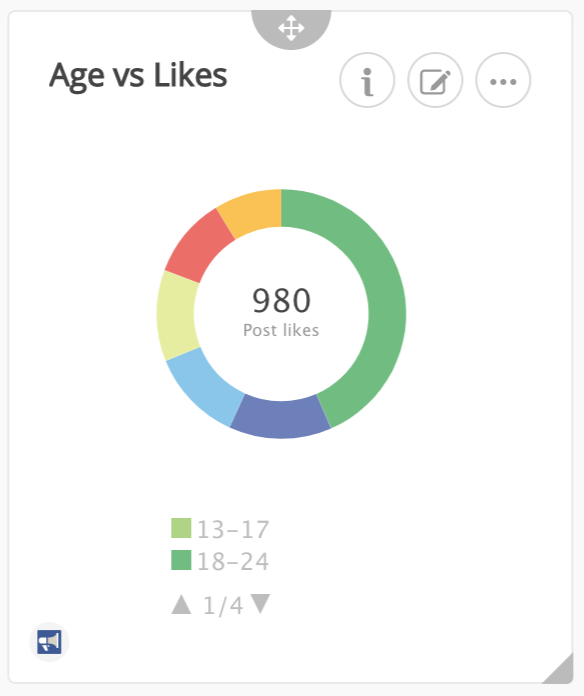
Explanation – This doughnut chart shows the proportion of people within certain age bands and how many “likes” they gave your posts.
Metrics – Post likes
Category – Age
Graph Type – Donut
Filters – None
Date Range – Set as appropriate
5. People Taking Action vs Country
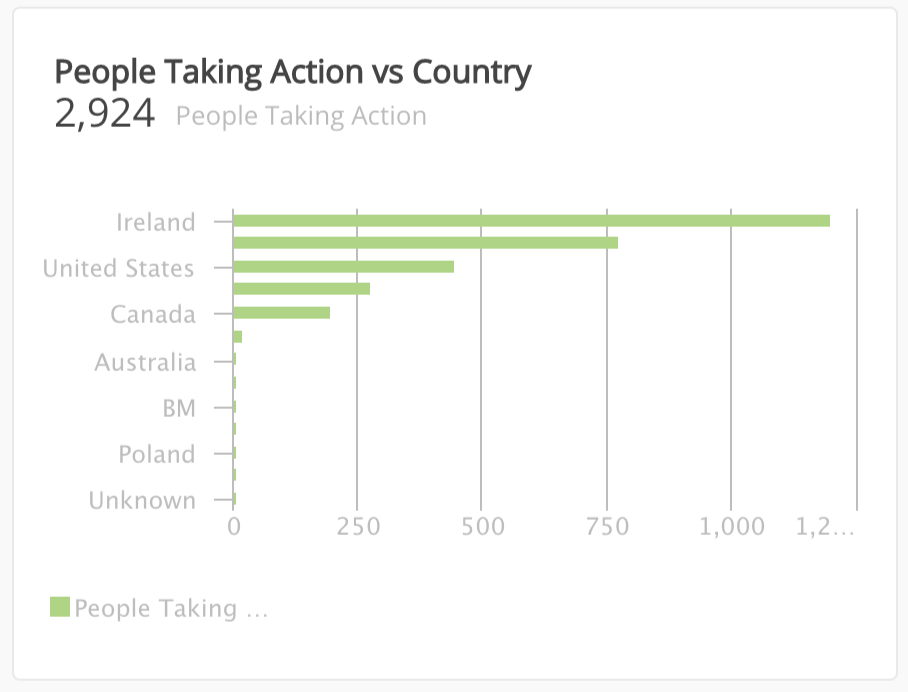
Explanation – A look at where in the world your Facebook page and posts are receiving the most interaction in the form of comments, likes and shares.
Metrics – People Taking Action
Category – Country
Graph Type – Bar
Filters – None
Date Range – Set as appropriate
6. Progress Bar (3000 Post Likes!)
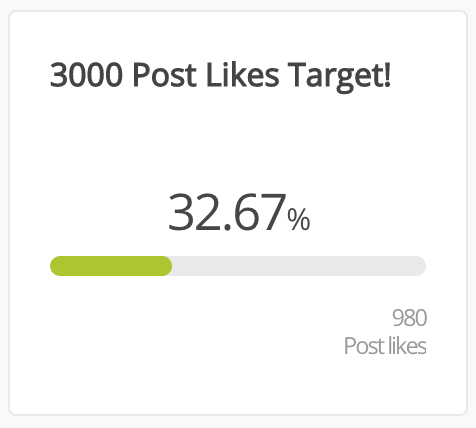
Explanation – You can create progress bars to keep track of specific targets. Here are the details for setting up a target for 3000 post likes:
Metrics – Post Likes
Goal Value – 3000 (as an example)
Graph Type – Progress Bar (Bottom of list)
Filters – None
Date Range – Set as appropriate
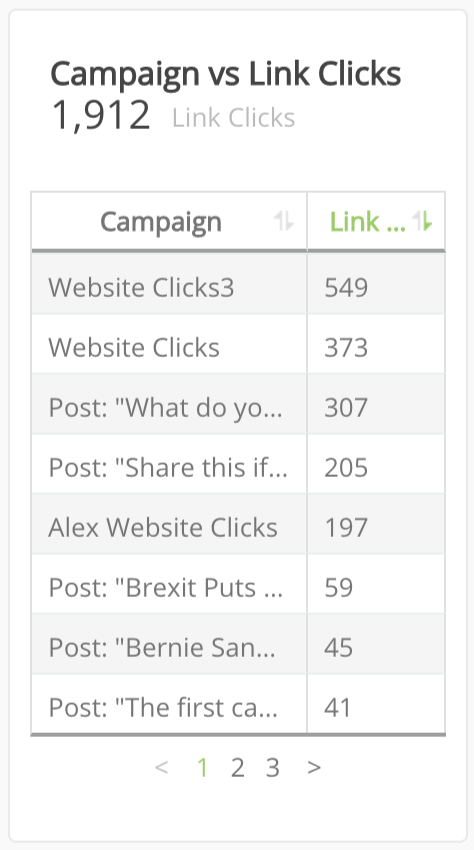
7. Campaign vs Link Clicks
Explanation – You can see what links from your campaigns gathered the most clicks.
Metrics – Link Clicks
Category – Campaign
Graph Type – Table
Filters – None
Date Range – Set as appropriate
Sort – Link Clicks, Descending
