How to edit and customize cards (widgets)
Now that you’ve created your first dashboard in Datadeck and added a few cards, we’ll show you how to customize these cards, so you can truly display the most relevant data that you need to make data-driven-decisions.
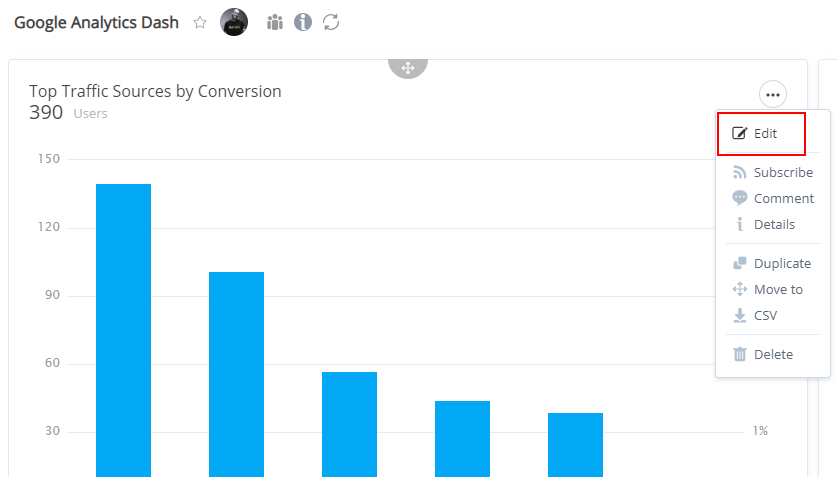
- Go to the dashboard and select the card you’d like to edit

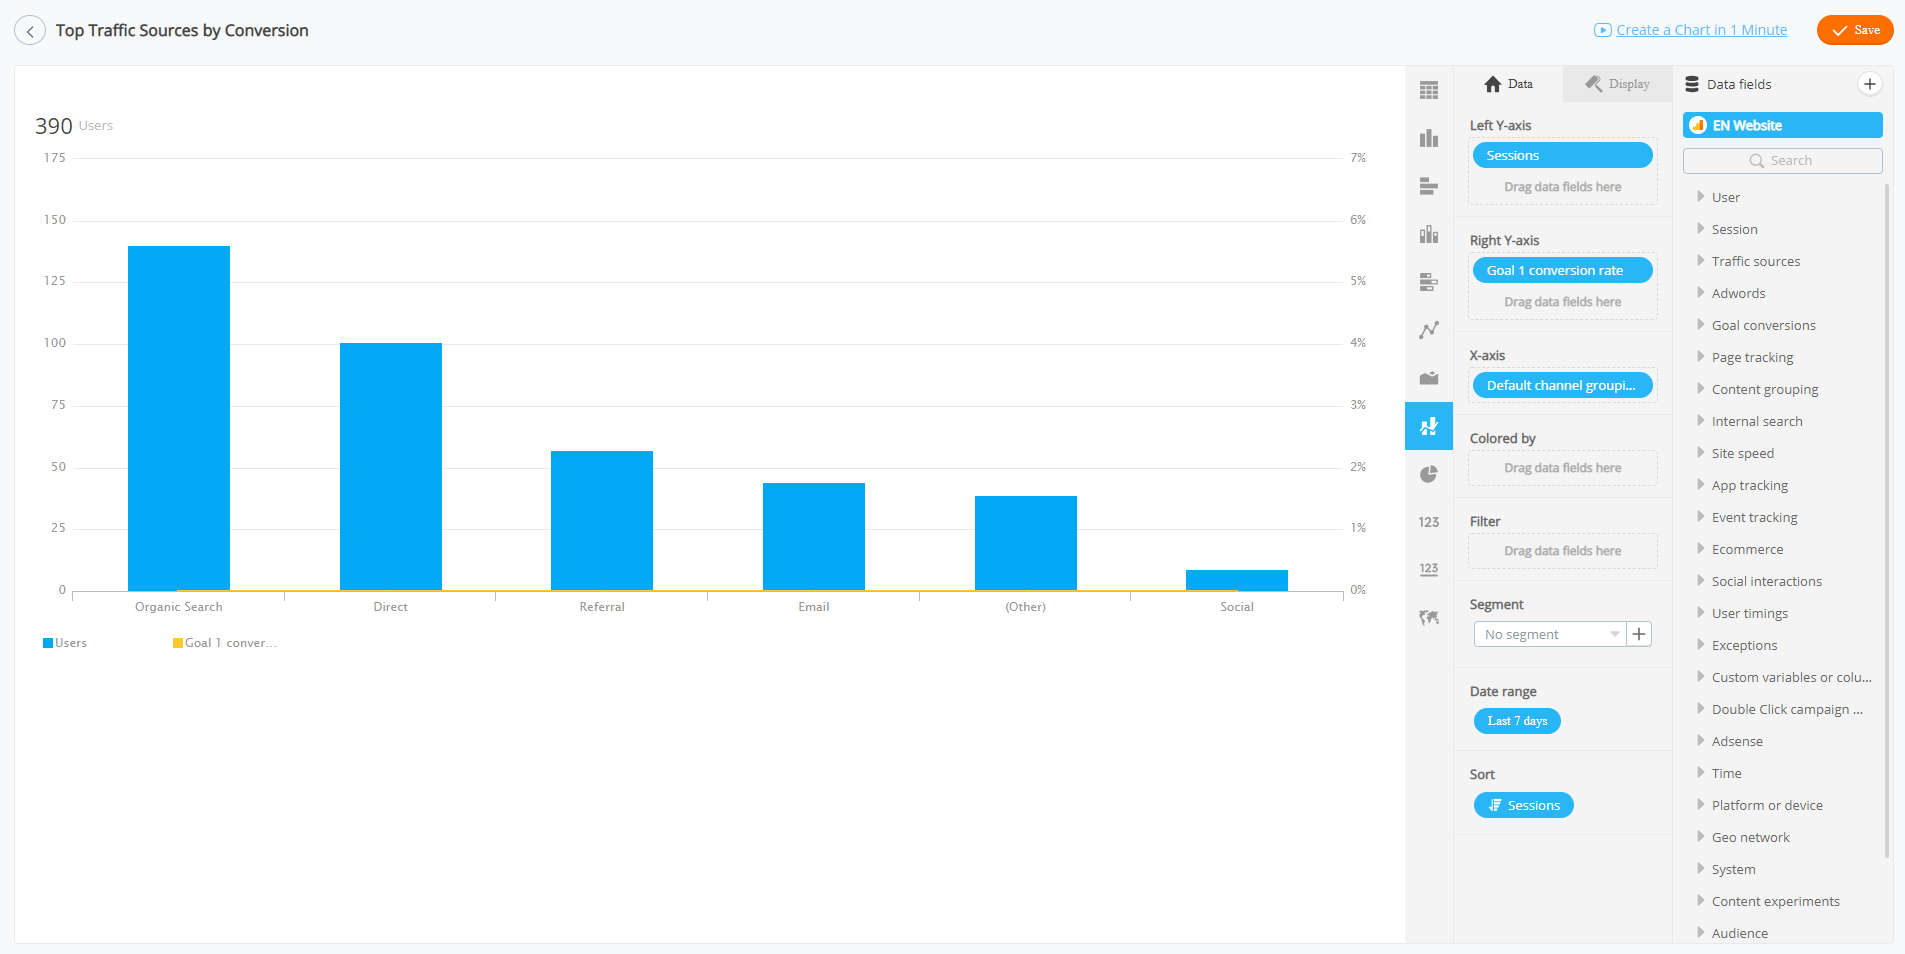
- Datadeck will load the card editor

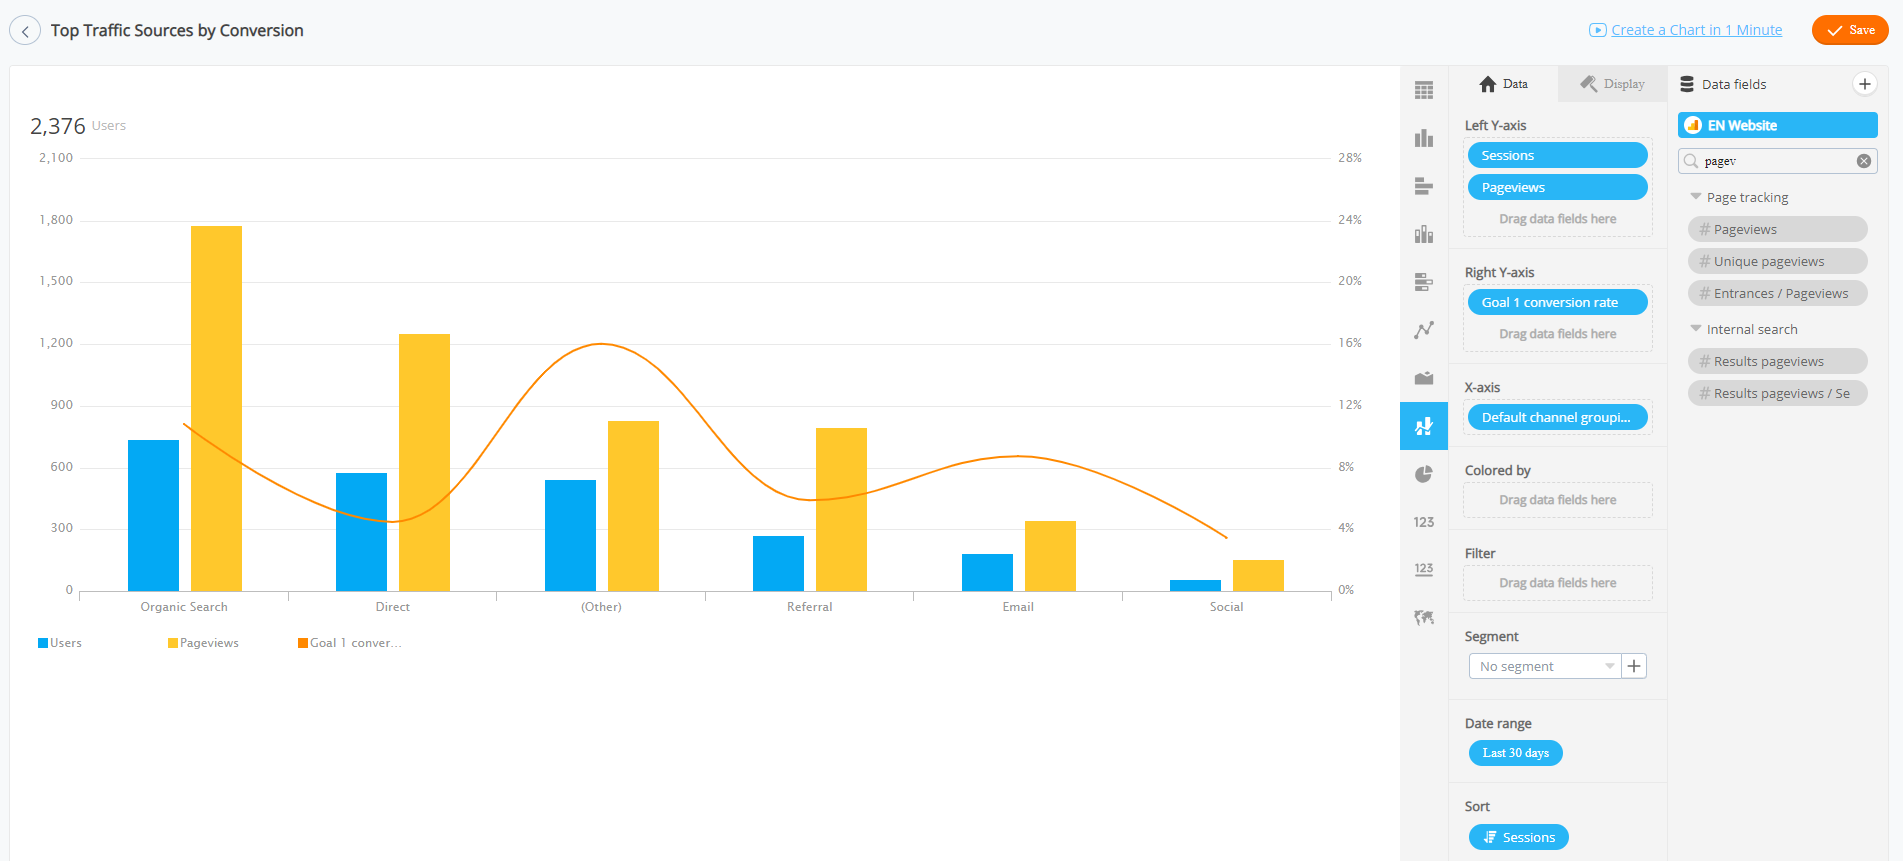
- In this case I want to change the data range to 30 days and add an extra metric to see my pageviews.

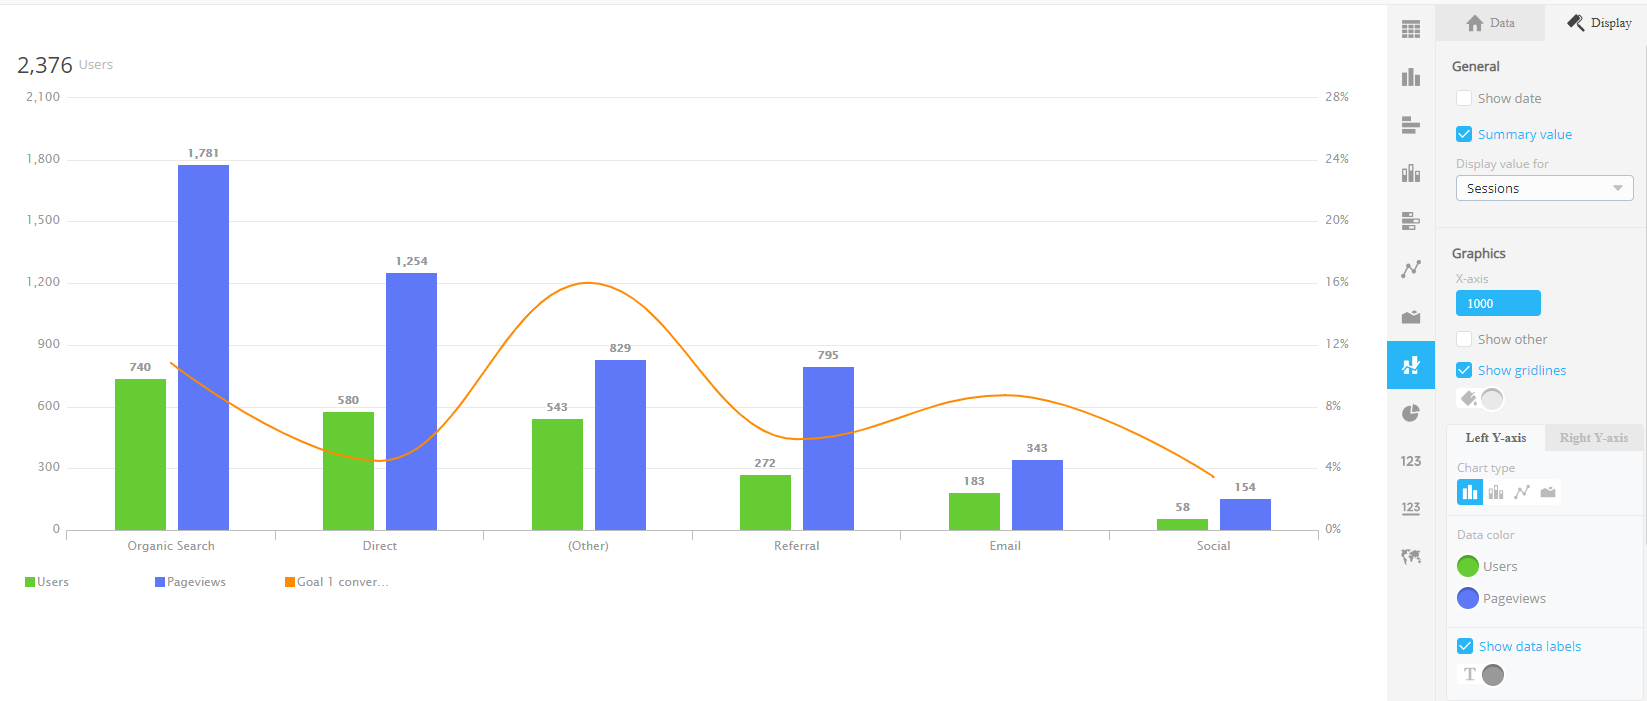
- By clicking Display, you’ll be able to change colors and presentation of the chart…

- When you are done with all your edits/changes click Save
